Loading
Search
▼ Survey: Japan’s Ishiba Cabinet Receives 51% Approval Rating; Ruling Party Gets Boost After New Prime Minister Takes Post
- Category:Other
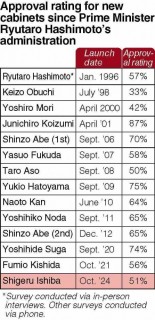
The approval rating for Prime Minister Shigeru Ishiba’s Cabinet stands at 51%, and support for the ruling Liberal Democratic Party has noticeably rebounded since Ishiba became its new leader, according to a Yomiuri Shimbun survey.
The nationwide survey was conducted from Tuesday — the day the Cabinet was inaugurated — through Wednesday.
Support for Ishiba’s Cabinet was more than double the approval rating of 25% for former Prime Minister Fumio Kishida’s Cabinet in the previous survey conducted from Sept. 13 to 15. The disapproval rating for Ishiba’s Cabinet was 32%, a sharp drop from the 63% logged by Kishida’s Cabinet last month.
Support for the LDP climbed seven percentage points to 38%, recovering to the same level as a May 2023 survey that was conducted after the Group of Seven summit meeting held in
The Yomiuri Shimbun has conducted public opinion surveys soon after the inauguration of new cabinets ever since the Cabinet of Prime Minister Masayoshi Ohira in 1978.
Among the administrations, the Cabinet of Prime Minister Junichiro Koizumi recorded the highest approval rating of 87%. Support for Ishiba’s Cabinet was below that of his most recent predecessors Kishida (56%), Yoshihide Suga (74%) and the second administration of Shinzo Abe (65%).
The most common reason cited for supporting Ishiba’s Cabinet was, “There are no other good people,” which was selected by 37% of respondents.
Twenty-one percent of respondents said they “could trust the prime minister,” 19% said they “have high expectations for the administration’s policies,” and 9% said “because it’s an LDP-centered administration” and “the prime minister has leadership qualities.”
When asked why they did not support the new Cabinet, 24% of respondents said “because it’s an LDP-centered administration,” 20% said they “have no expectations for the administration’s policies,” 18% said they “could not trust the prime minister” and 15% felt “other good people were available.”
According to the survey, 43% of respondents did not support Ishiba’s overall picks for his Cabinet or the LDP executive lineup, eclipsing the 35% who did.
On the appointment of Hiroshi Moriyama as LDP secretary general, 32% of respondents approved of the appointment, while 37% did not. Ishiba’s choice of Shinjiro Koizumi as the party’s Election Strategy Committee chairperson was welcomed by 53% of respondents, but 35% were against the move.
As for which policies and issues should be prioritized by the new Cabinet with multiple answers allowed, 88% of respondents said “economy and employment,” 75% said “education and child rearing,” 71% said “social security,” 68% said “diplomacy and security” and 65% said “fiscal reconstruction.”
Of the respondents, 62% supported Ishiba’s willingness to revise the Japan-U.S. Security Treaty and the Japan-U.S. Status of Forces Agreement. Only 22% of respondents disagreed with Ishiba’s stance on the issue.
Support for political parties other than the LDP did not shift significantly. The Constitutional Democratic Party of Japan was supported by 7% of respondents, up from 5% in the previous survey; Japan Innovation Party was backed by 3%, which was unchanged; Komeito was supported by 3%, up from 2%; and the Japanese Communist Party was unchanged at 2%.
Forty percent of respondents said they did not support any particular party, down from 48% in the previous survey.
Little change
When asked which party they intended to vote for in the proportional representation section of the next House of Representatives election, 39% of respondents chose the LDP, an increase of four percentage points from the previous survey conducted in September.
Support for the other parties hardly budged, as the CDPJ held steady at 12%, JIP slipped one percentage point to 7%, Komeito was unchanged at 4% and Reiwa Shinsengumi crept up one percentage point to 4%.
Nineteen percent of respondents said they had not decided which party to vote for, down one percentage point. Only 6% of respondents did not give an answer, down from 12% in the previous survey.
The survey collected 1,095 responses from people aged 18 or older by calling 2,668 landlines and mobile phones.
The rates were rounded to the nearest whole number, and the total percentage might not equal 100% in the graph or table.
- October 3, 2024
- Comment (0)
- Trackback(0)


